As before, I downloaded the entire budget detail from the "Office of Management and Budget". These data were analyzed using statistical techniques to establish the Annual Compound Growth Rate (CAGR) for each presidential term. There has been one four year term for each political party (Carter, Bush1) and I have calculated Trumps CAGR using all 7 years included in the 2018 Federal Budget (through 2023).
I also launched this analysis as a way of trying to confirm (or disprove) the many comments from the Trump Administration concerning Trump's superior performance relative to previous Presidents. Here are some top line findings. Combining Presidential performance on the growth rates of all financial results, Trump is in a 3 way tie with Nixon/Ford and Bush 2 for SECOND TO LAST place among all Presidents. Bettering Trump are Reagan, Obama, Carter, Kennedy/Johnson and Clinton. Bush 1 has the lowest score of all Presidents. The scoring is based on assigning 2 points for best performance in a category and 1 point for second best. Also, -2 points for worst performance in a category and -1 point for second worst. (Good is considered high growth in Receipts and GDP; Bad is high growth in Spending and Deficit/Debt).
Looking at the individual categories, Trump is NOT best in any category! Lately, we have heard much discussion of GDP, of which he has the 3rd LOWEST growth rate. This happens to be below the Republican average growth. He is at the Republican average for Real GDP Growth. Below you will find the complete table of results.
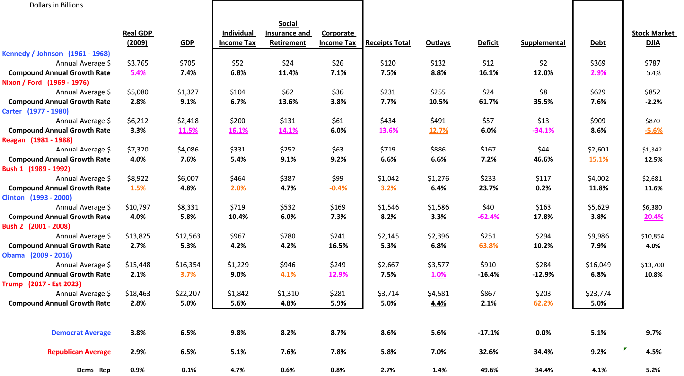
Trump's growth rates for all categories are in the middle of the pack in most cases. However, he has the worst (highest) growth rate in Supplemental Spending (off-budget). With the recently passed tax plan, there are still 3 Presidents with slower growth in Individual Taxes (Bush 2, Bush 1 and Reagan) and 2 Presidents with slower growth in Corporate Taxes (Bush 1 and Nixon). Notice that compared to Obama, Trump has reduced Tax Receipt growth by 1/3, while at the same time quadrupling the growth in Outlays (spending).
Here are a couple of examples of how Compound Annual Growth Rates are determined. First is the graph of Trump's GDP that we have mentioned above:

The green, white and red sections around the data are statistical limits which are helpful in determining if all of the data fall within a "normal" range which helps identify "outliers". If there are no outliers, the growth rate is determined. It can be found in the data box, just above the blue highlighted number.
One of the sub-categories of "Outlays" or spending is Total Net Interest on the Federal Debt which is shown below:

In this case the Trump's growth of the Interest on the Debt is 15.8% compounded annually. As you can see the slope of line is quite a bit steeper, reflecting the higher debt growth and higher interest rates that are likely to increase with such high national debt. This has not been much discussed in the press but is a good summary of Trump's tax plan.
Keep in mind that 6 of the 7 Trump years analyzed are FORECASTED numbers. Based on this and the likely hood that forecasted numbers are based on optimistic assumptions, it will be critical to reassess these conclusions as actual spending is posted in the years to come.
My belief is that success in government should be evaluated not by orders signed or regulations reduced, but by the financial health of the country and its citizens. There is not evidence that a "best ever" claim is yet deserved.